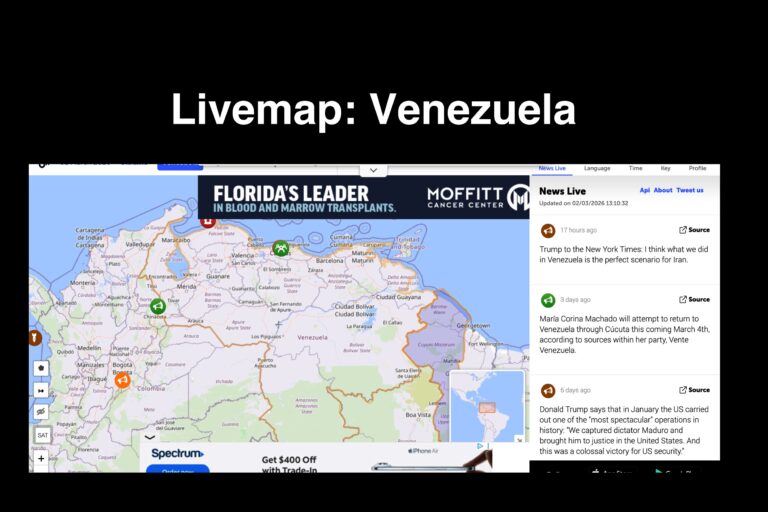
LiveUAMap’s Venezuela map is a real-time monitoring platform that displays political developments, protests, security incidents, and military activity across Venezuela on an interactive geographic interface. The site geolocates breaking news reports onto a live map, allowing users to see where events are occurring instead of relying on scattered headlines or delayed summaries.
LiveUAMap operates as a mapping-based news aggregation system. The platform collects information from multiple sources — including reporting, social media posts, and official statements — and places verified incidents onto a geographic timeline so users can track developments spatially and chronologically. For researchers, this turns fast-moving political events into something measurable: you can follow where protests start, where security forces deploy, and how activity spreads across regions.
For investigative research, mapping matters. A traditional article tells you what happened. A geolocated map helps you understand patterns. Analysts can compare events over time, document recurring locations, and correlate incidents with elections, economic announcements, sanctions, or leadership decisions. The archive function also allows timeline reconstruction — useful when trying to determine whether a development was spontaneous or coordinated.
Because the platform aggregates open-source information, it should be treated as an awareness and research tool rather than a sole primary source. Its real power comes when combined with reporting, public records, and official documents. Researchers frequently use tools like this to verify claims, cross-check reports, and build structured timelines of political instability and conflict activity.
In plain English: it lets you watch events unfold on a map instead of reading about them after the fact.