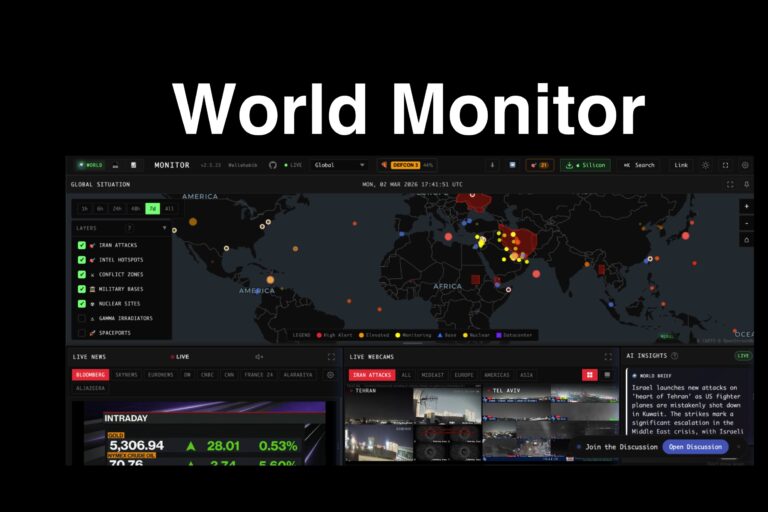
World Monitor is an interactive global intelligence dashboard that maps real-time world events onto a single visual interface. The platform aggregates open-source data and displays conflicts, military activity, sanctions, infrastructure outages, geopolitical hotspots, natural disasters, economic disruptions, and international incidents on a live global map. Instead of reading scattered news reports, users can visually see where events are happening and how they relate geographically.
For researchers and activists, this functions as a situational awareness tool. Investigations often begin with noticing patterns — where military activity increases, where sanctions appear, or where infrastructure failures cluster. The map allows users to monitor developing conflicts, track military positioning, observe international tensions, and identify emerging crises before they reach mainstream coverage.
The tool is particularly useful for timeline building and contextual research. Journalists and investigators can compare world events to policy decisions, political messaging, or economic developments occurring at the same time. Analysts often cross-reference these types of dashboards with official government statements, satellite reporting, and news coverage to understand not just what happened, but why it may have happened.
Because the system aggregates open-source reporting, it should be used as an awareness and monitoring platform rather than a primary source. Its strength is speed and visualization — it helps users identify events worth investigating further. For educators, watchdog researchers, and geopolitical observers, it provides a centralized overview of global instability, conflict activity, and international developments.
In simple terms: it’s a live map of “what’s happening in the world right now.”